Agent operations · 13 min read
Most enterprises we meet have already bought the infrastructure. Very little of it is in production. Here is the distance between a served model and a working agent, walked one screen at a time.

Prem Naraindas
Founder and CEO, Katonic AI
The distance
“We have GPUs” and “we have AI” are different sentences.
Six steps between them. None is a model.
“We have GPUs” and “we have AI” are different sentences.
Most enterprises we meet have already said the first one. GPUs in their own building. Models deployed and served. A platform team that knows how to run them. And still, when you ask what is in production, the answer is a pilot, a proof of concept, or a chatbot three people use.
The distance between a served model and a working agent is where those pilots die. We have said before that the distance is six steps: connect, build, act, deliver, govern, improve. What we have not done is show them.
So this post takes one agent through all six, on screen. It is a customer support assistant, the most ordinary agent there is, which is the point. We build it, we publish it, we look at what it actually costs to answer a question, and then we make it better and cheaper without touching the model. At the end there is a short section on what we found when we did the same thing to a real deployment.
One note on what sits underneath, so nobody reads the next fourteen screens as a model story. Every agent built in Katonic Studio compiles to an NVIDIA NeMo Agent Toolkit workflow and runs on that runtime. The model it calls is served on GPUs the enterprise owns, through NVIDIA NIM or vLLM behind the AI Gateway, or on any OpenAI-compatible endpoint. Nothing in this post depends on which.
The model never moves. Everything happens around it.
Step 1
Connect
The model reaches the data it is allowed to see, and nothing else.
Step 2
Build
With the person who owns the business problem, not for them.
Step 3
Act
The agent takes the action, with a human approving the step that matters.
Step 4
Deliver
Inside the tools people already use, not in one more tab.
Step 5
Govern
Who ran what, on which data, at what cost.
Step 6
Improve
From what real users did with it, not from what the demo did.
Act one
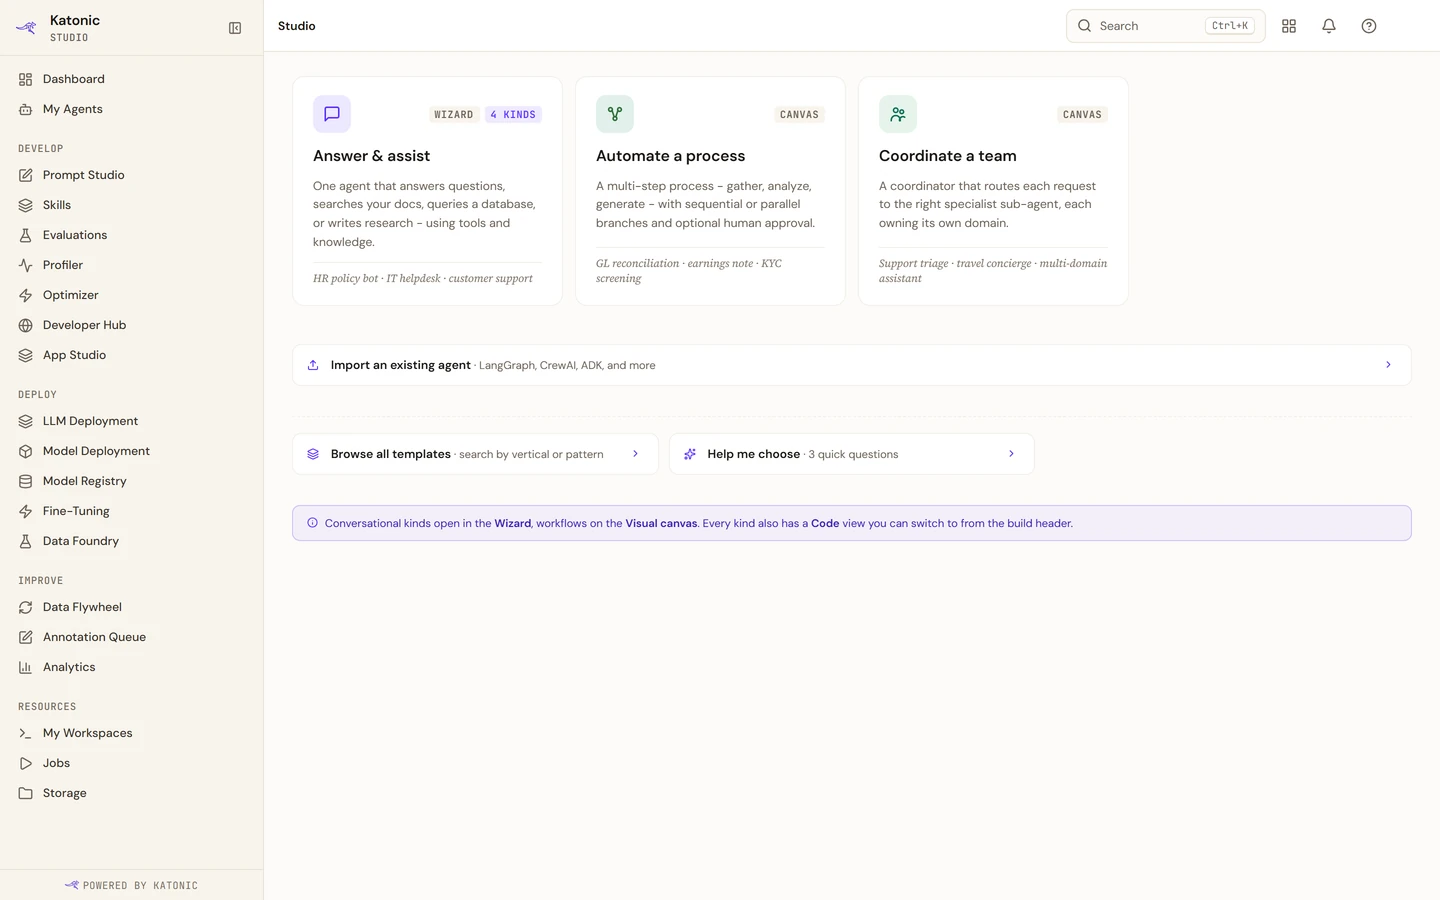
Studio opens on a choice of three kinds: one agent that answers questions from your documents and tools, a multi-step process with branches and optional human approval, or a coordinator that routes each request to a specialist sub-agent. Agents already written in LangGraph, CrewAI or Google ADK can be imported instead. Whatever the framework, the output is one NeMo Agent Toolkit workflow package, so the same governance, observability and audit log apply to an imported agent as to one built here.
We pick answer and assist.
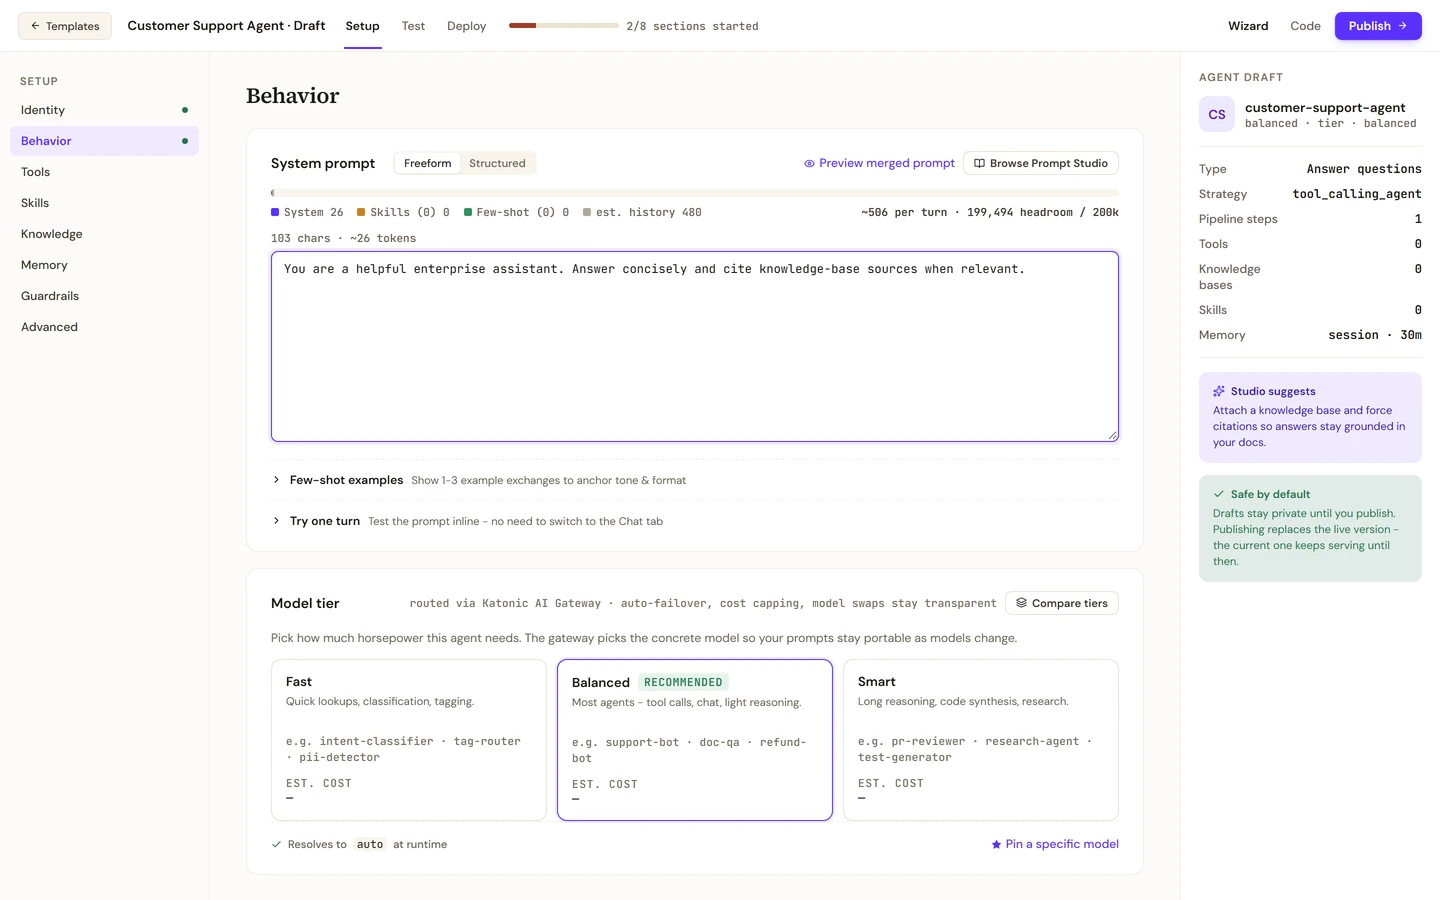
The behavior step holds the system prompt and the model choice. We start the prompt deliberately short. The baseline in this walkthrough is 26 tokens: a helpful enterprise assistant that answers concisely and cites its sources. It will get longer in act three, and not because we guessed.
The model choice is a tier, not a name. Fast, balanced or smart, routed through the AI Gateway, which picks the concrete model from whatever is served and fails over when one is down. You can pin a specific model if you need to. Either way the prompt stays portable when the model changes, which it will. Behind the tiers sit the models you already serve. The gateway discovers NVIDIA NIM endpoints running on your own GPUs and prefers them for on-premises routing, with vLLM and allow-listed cloud models as the other options.
This is where the second step, build, earns its “with, not for”. The Test tab runs the draft through the same executor that serves published agents, real prompt, tools and knowledge, and shows the answer beside a step-by-step trace. The person who owns the support queue sits here and breaks it. Every bad answer they find now is one a customer does not.
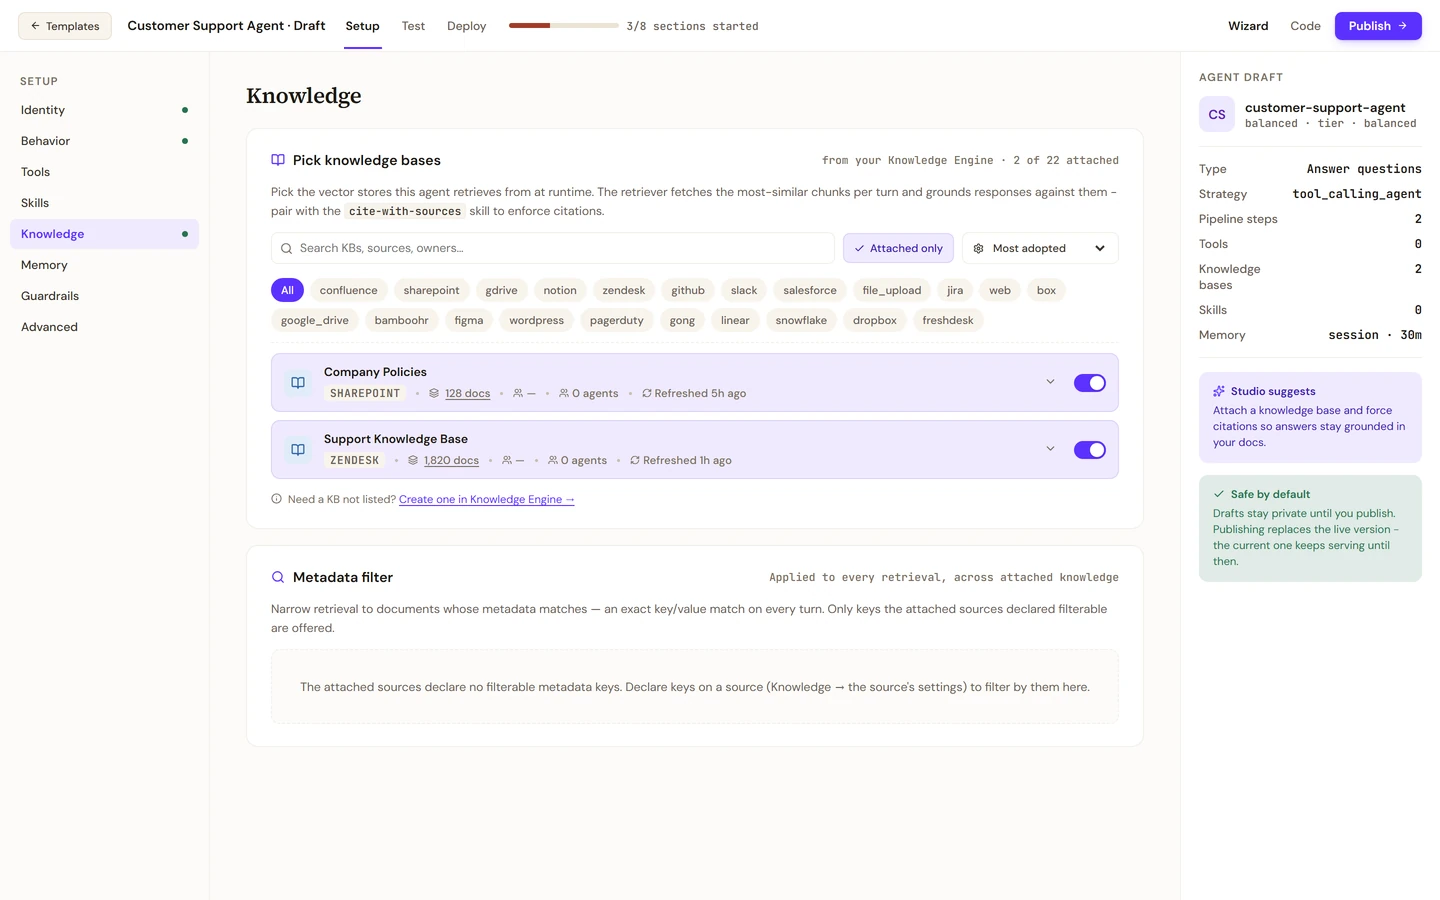
The knowledge step lists every knowledge base the platform already indexes, twenty-two in this workspace, from SharePoint and Confluence to Salesforce, Zendesk and plain file uploads. We attach the two the support team actually uses, the company policies and the support knowledge base, and leave the other twenty alone.
Two rules sit behind that screen. The agent retrieves only from what is attached, and within that, a user gets back only the passages their own permissions allow. The model reaches the data it is allowed to see, and nothing else. That is the first step, connect, and it is a configuration decision, not a model capability.
Hold on to the fact that we scoped to two sources. It comes back in act two with a price tag.
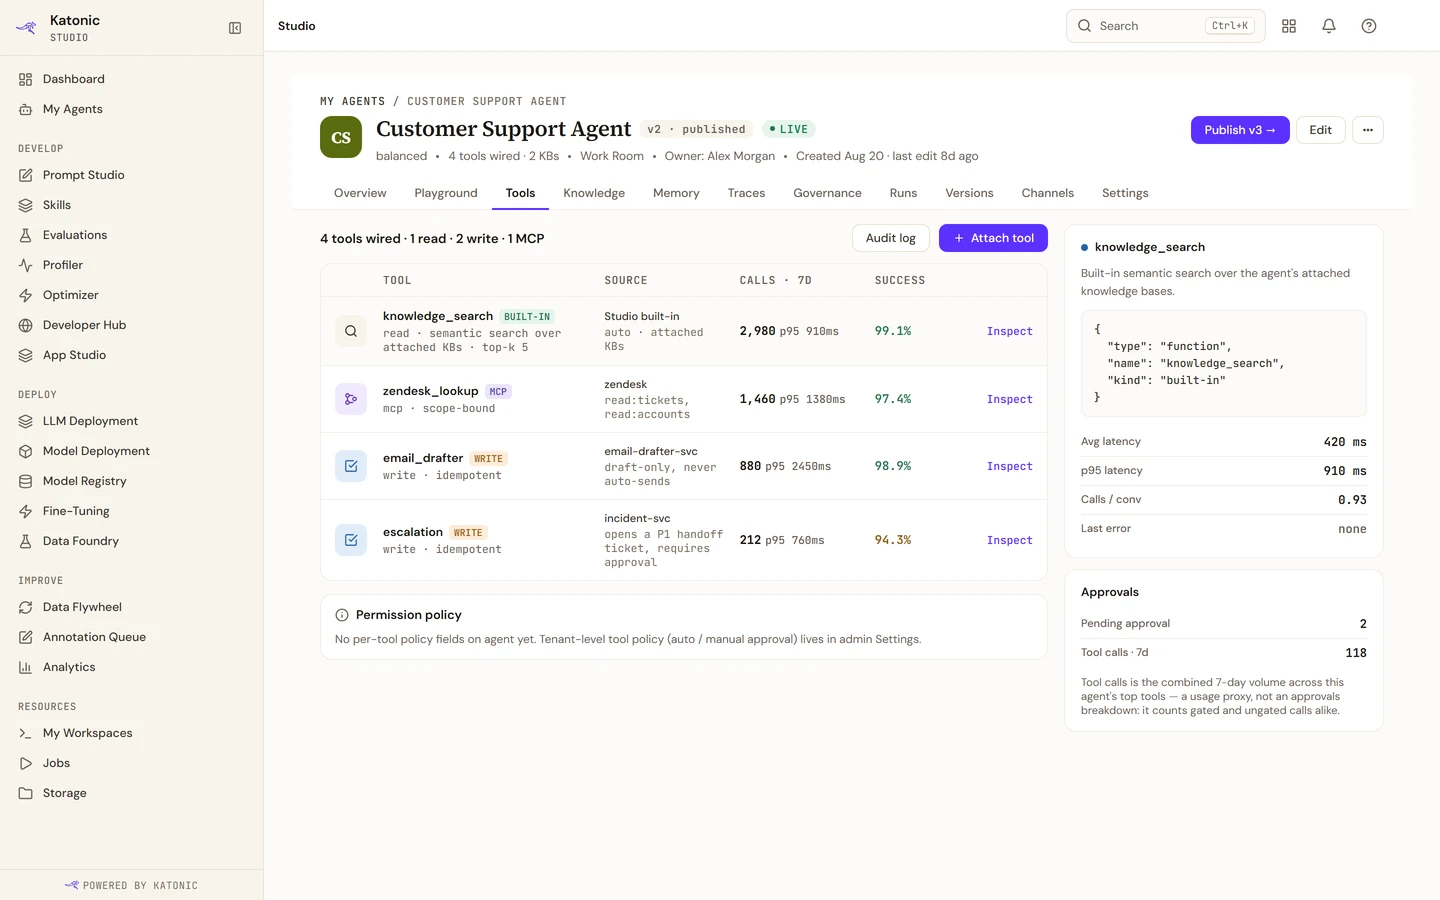
An assistant that only talks is a search box with manners. This one has four tools. Knowledge search, built in. A ticket lookup over the helpdesk, read-only and scoped to tickets and accounts. An email drafter that writes but never sends. And an escalation tool that opens a priority ticket and requires approval before it does.
That last line is the third step, act. The agent takes the action, and a human approves the one that matters. Not every action, which would make the agent pointless, and not none, which would make it dangerous. The approvals panel on the same page counts what is waiting on a person.
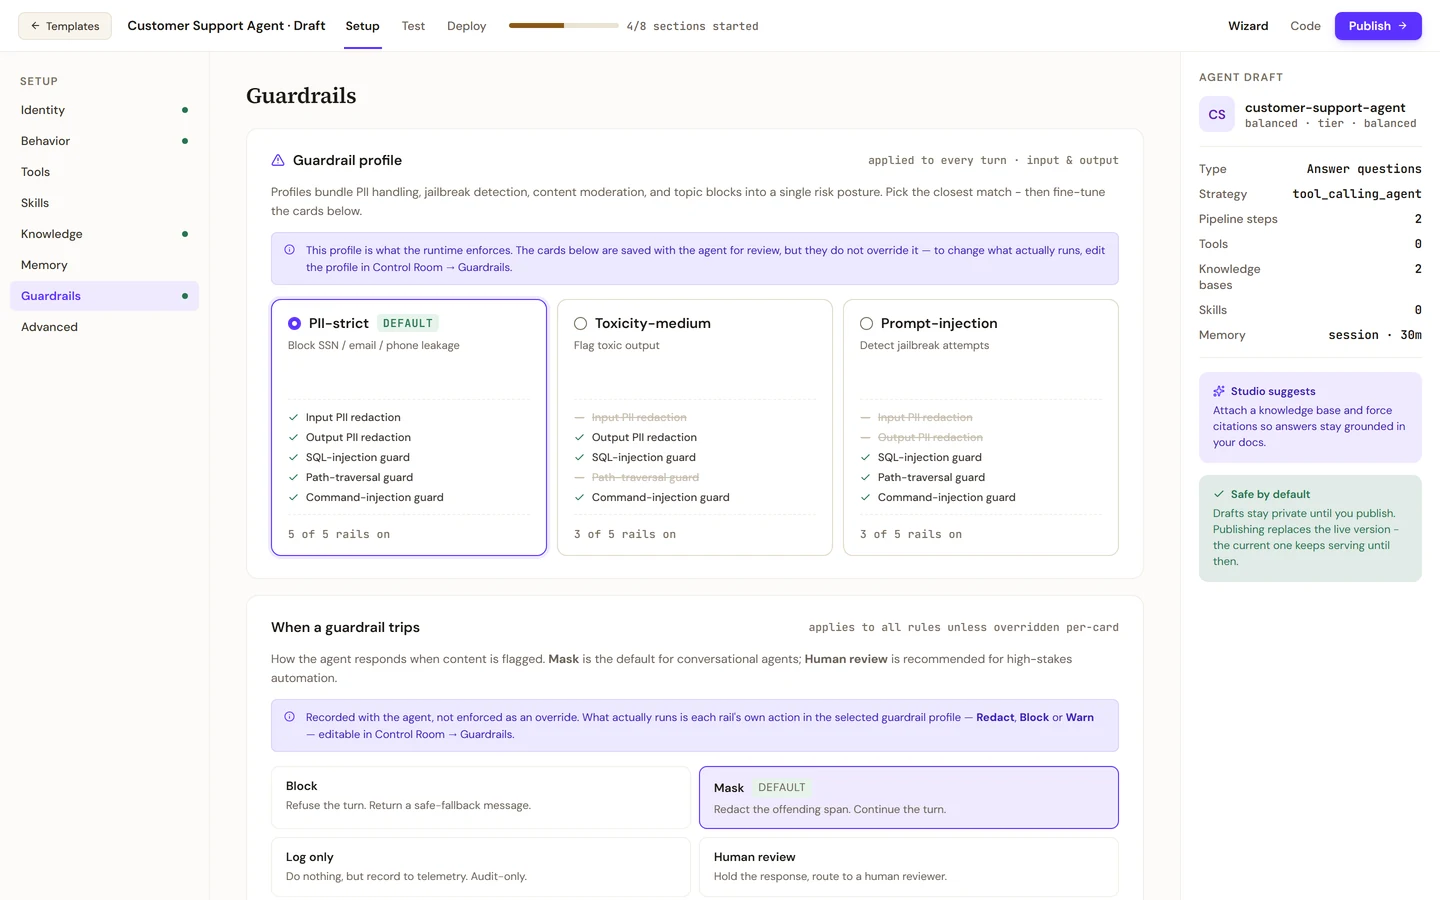
Guardrails are a profile applied to every turn, input and output: personal data handling, jailbreak detection, content moderation, topic blocks. What happens when one trips is a choice: block the turn, mask the offending span and continue, log only, or route to human review. Without a profile selected the agent publishes ungoverned, and the page says so in a warning you cannot miss.
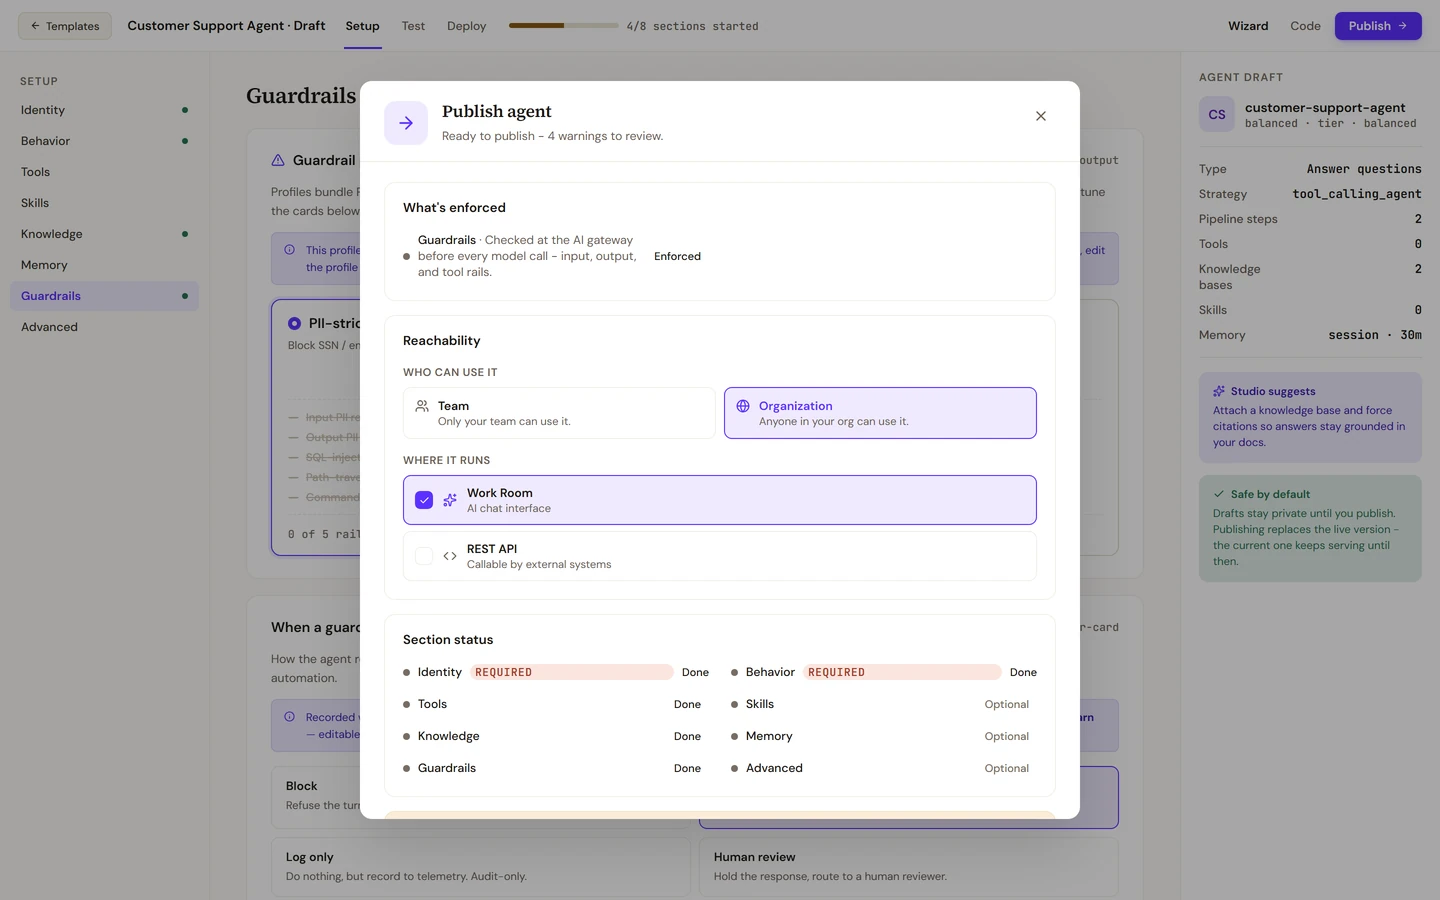
The publish step asks two questions. Who can use it: your team or the whole organisation. Where it runs: as a chat thread in the Work Room, where people already are, or as a REST endpoint that external systems call with a bearer token, or both. A pre-flight list checks the things that get forgotten, from the guardrail profile to whether the Test tab was ever run.
Publish makes the draft the live version. The previous version keeps serving until the new one is ready, and rollback is a click on the versions tab.
That is the fourth step, deliver. Inside the tools people already use, not in one more tab.
Version one is live. This is where most pilots stop. The next two acts are the work the pilots skip.
Act two
The Profiler works from two inputs, and it refuses to guess without them. It needs traces, which the agent emits as it handles real conversations. And it needs a judge, a model that scores every answer for helpfulness, hallucination and refusal. Until a judge is configured, the quality figures stay empty rather than invent a number.
We mention this because a dashboard that guesses is worse than no dashboard. It gets trusted.
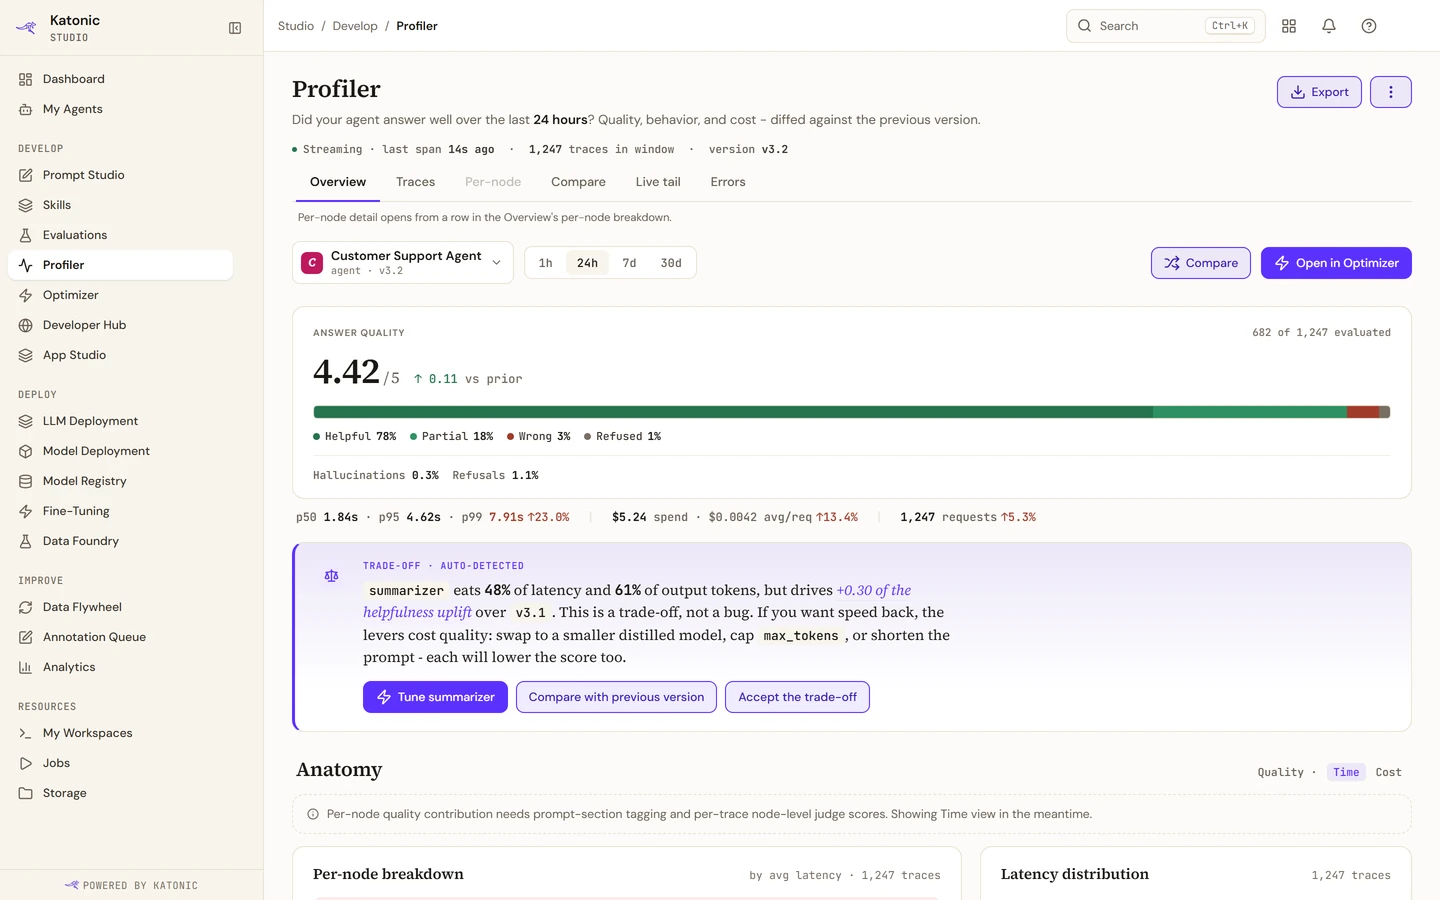
With a day of traffic behind it, the Overview reads like a report card. Answer quality on a five-point scale, with the split underneath: helpful, partial, wrong, refused. Hallucination and refusal rates. Latency at the median, the 95th and the 99th percentile. Total spend in the window, the average cost per request, and the number of requests, each with its change against the previous version.
Read that line of latency and cost again, because it is the fifth step. Who ran what, on which data, at what cost. Every figure on this screen traces back to a conversation a real user had.
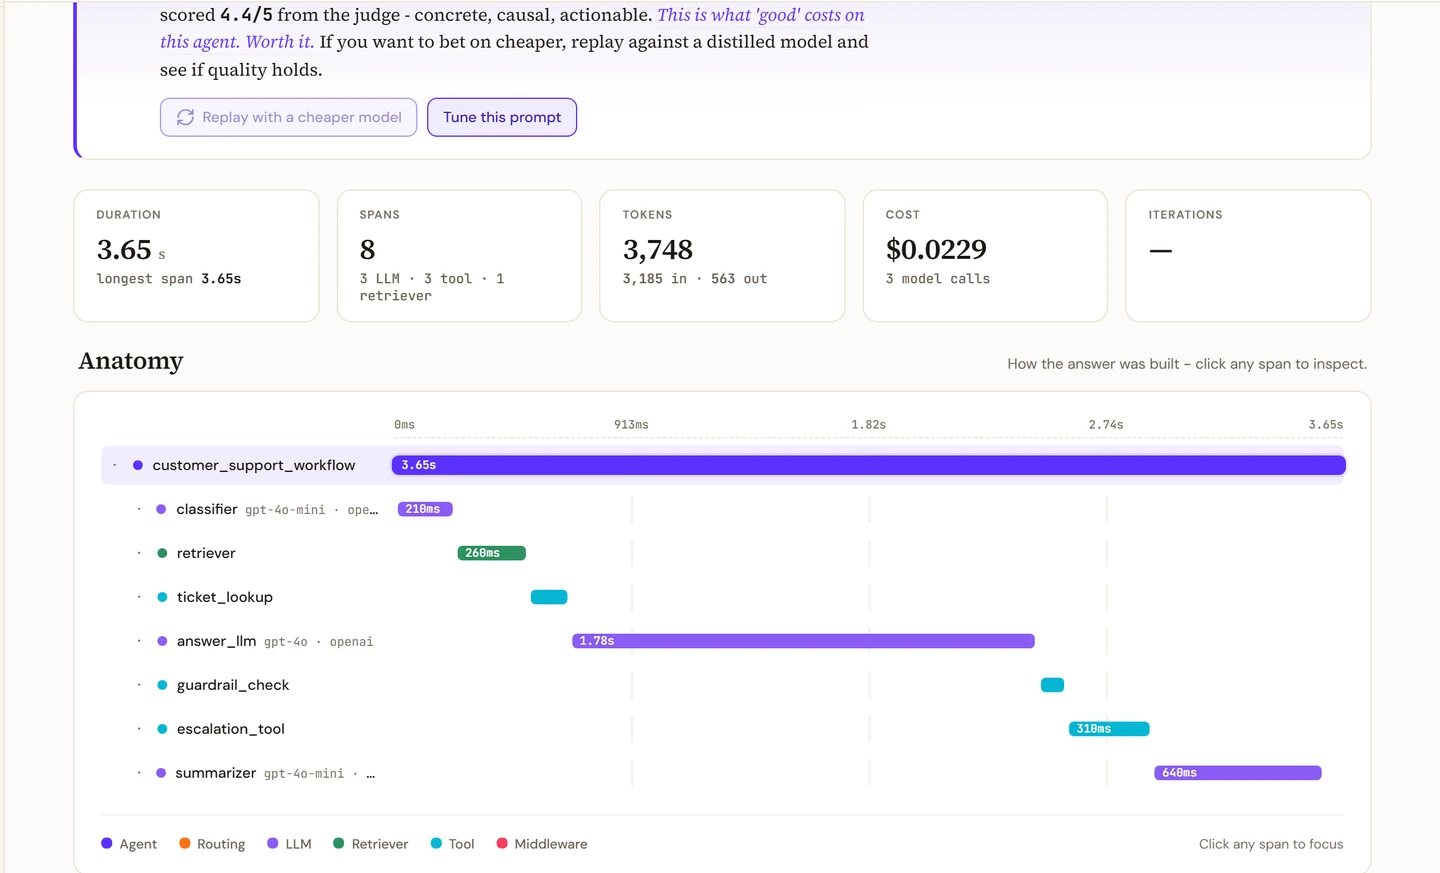
Open one trace and the agent stops being a box. The waterfall shows how the answer was built: a classifier on a small model, the retriever, the ticket lookup, the answer model, the guardrail check, the escalation tool, a summariser on a small model. Each span has its own duration and, where it called a model, the model's name. Above the waterfall sit the totals: duration, number of spans, tokens in and tokens out, and the cost of this one answer. The spans come from the NeMo Agent Toolkit runtime's own instrumentation, so an imported LangGraph agent traces exactly like one built in the wizard.
This is what “at what cost” means at the level of a single question. Not a monthly invoice. A price per answer, and a picture of where it went.

The Overview does one more thing that a monitoring tool does not. When one node dominates, it says so and says whether it is worth it. In this walkthrough the card reads, in effect: the summariser takes about half the latency and most of the output tokens, but it drives most of the helpfulness gain over the previous version. This is a trade-off, not a bug. If you want the speed back, the levers will cost quality.
Three buttons follow: tune that node in the optimiser, compare with the previous version, or accept the trade-off. Profiling that stops at “this is slow” leaves the decision to whoever is loudest in the room. Profiling that says “this is slow and here is what it buys you” leaves it to the numbers.
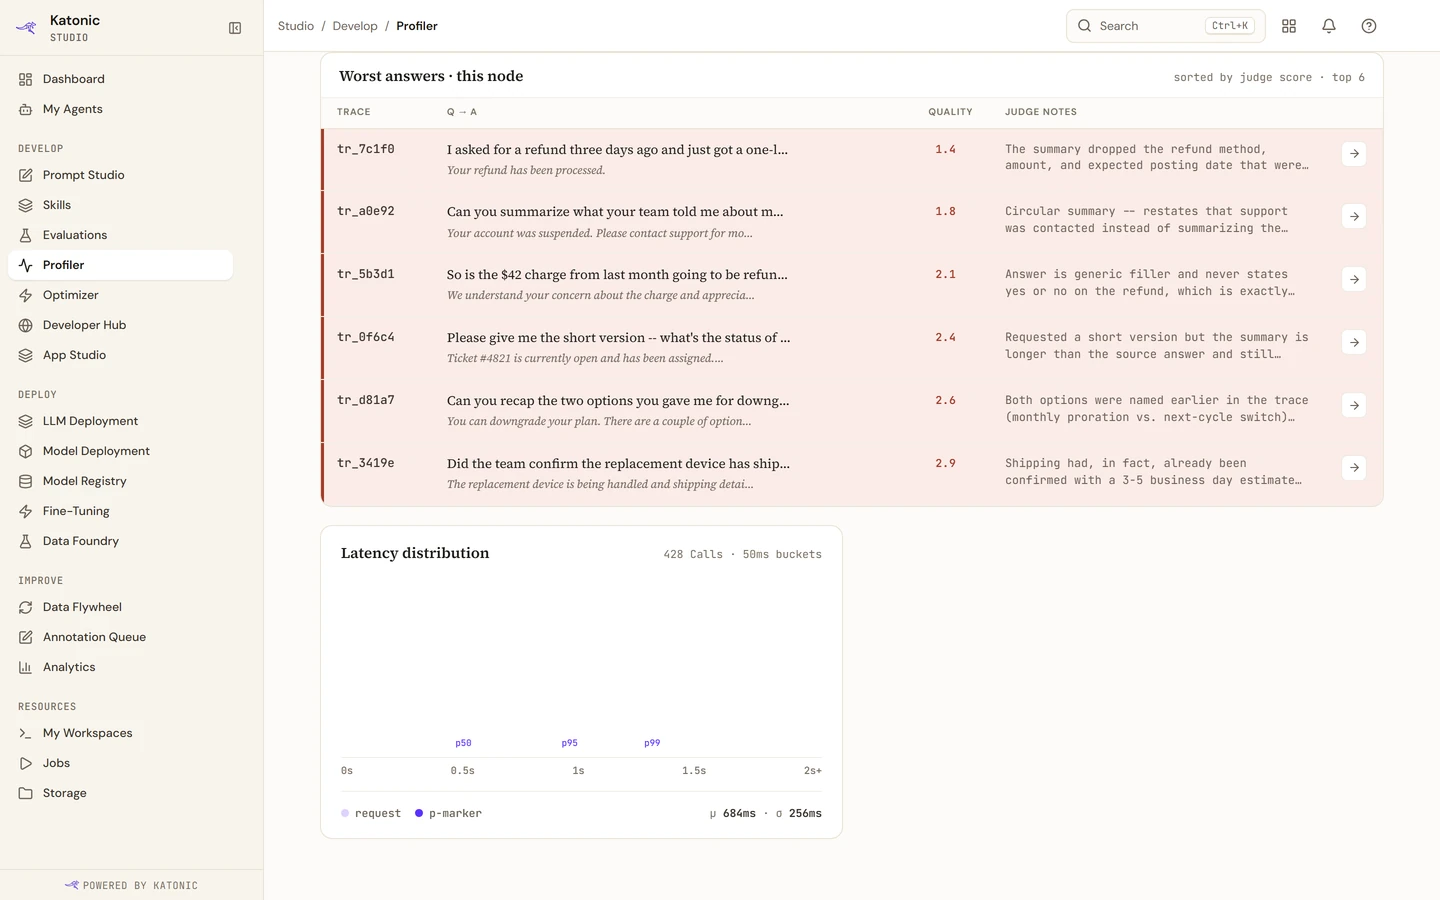
Click the summariser and you get its worst answers, with the judge's notes written the way a reviewer would write them: the summary dropped the refund amount and the posting date; the answer never says yes or no to the refund. Underneath, the node's latency distribution and its share of spend. The Issues view does the same across the whole agent, grouping bad answers, exceptions and SLO breaches by what is actually broken rather than by what threw, with one action per group.
Sidebar
The screens above come from a demonstration workspace. The numbers below do not. They come from profiling an employee assistant at one deployment, the kind of agent that answers “what is the parental leave policy” from the company's own documents.
Answering a question was a loop, not a call. At least two model turns every time, plus a small call to title the thread.
About 21,000 input tokens per question. Most of it was retrieved context and conversation history re-sent verbatim, enough that a per-user rate limit designed for chat would have allowed under three questions a minute.
Reranking was 52 percent of the cost per question. The search scope had been left at "all sources", which widened the candidate pool fourfold to 200 passages, every one of them sent to the reranker.
The model's own answer turns were 48 percent. Embedding the question was under 1 percent.
A fleet quality number we had been watching turned out to be measuring a broken retrieval path, not the agents. Retrieval was failing, the agents were refusing, and the judge was scoring the refusals.
The model was never the expensive part. And the quality metric was pointing at the wrong problem. Profile before you optimise, or you will optimise the wrong number.
Act three
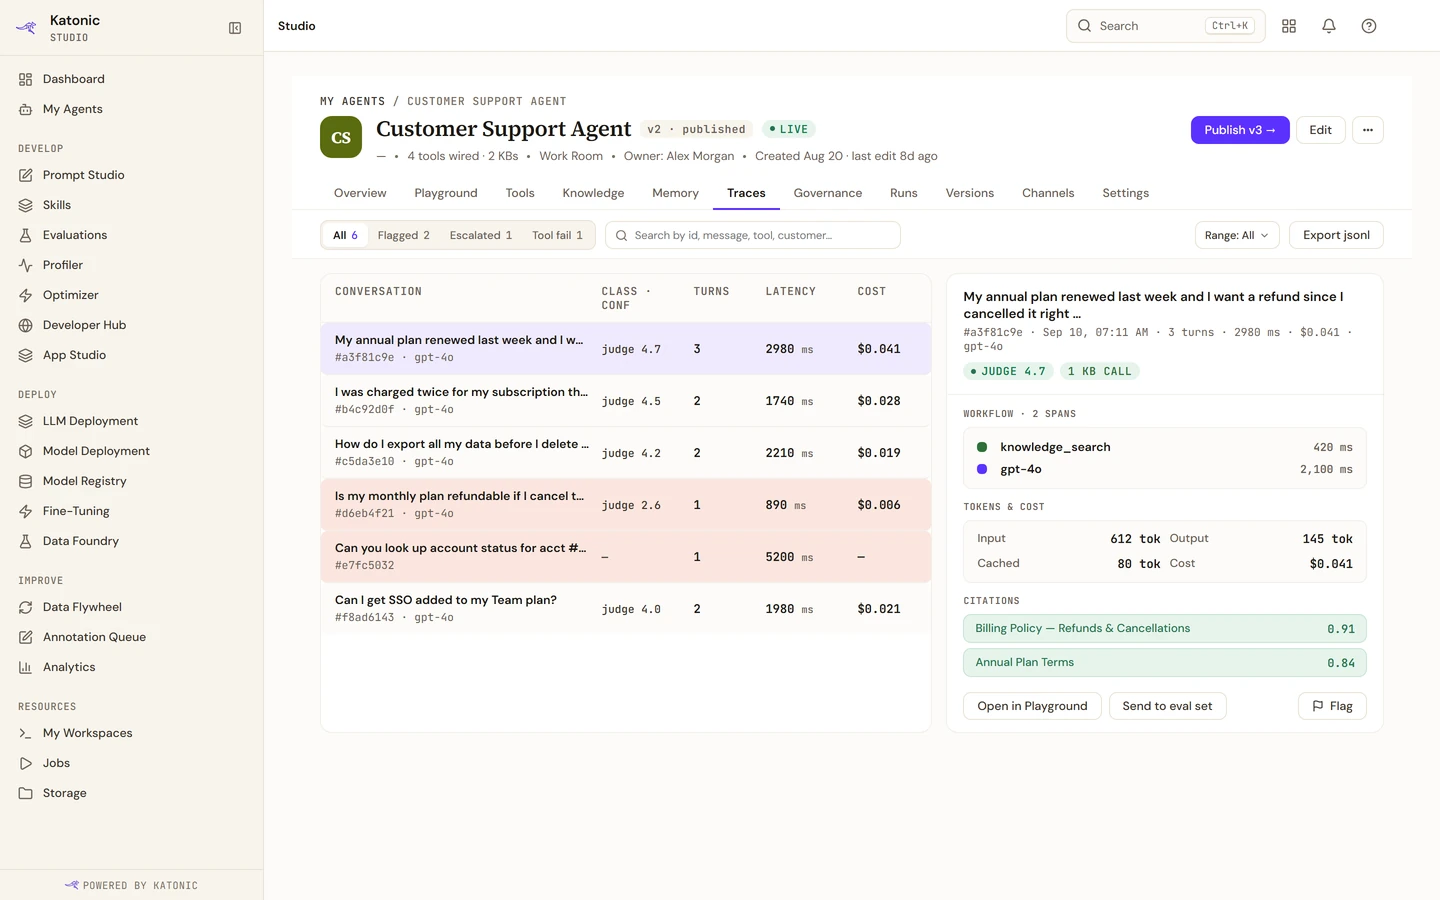
The traces tab on the agent page lists every conversation with its judge score, its turns, its latency and its cost, and filters for flagged, escalated and tool failures. Pick a bad one. The rail shows the question, the spans, the tokens, the sources it cited, and three actions: open in playground, send to eval set, flag.
Send to eval set captures the question and the answer you would rather have had, into a dataset. That is the shortest path from a user complaint to a regression test, and it is the sixth step, improve, in one click. From what real users did with it, not from what the demo did.
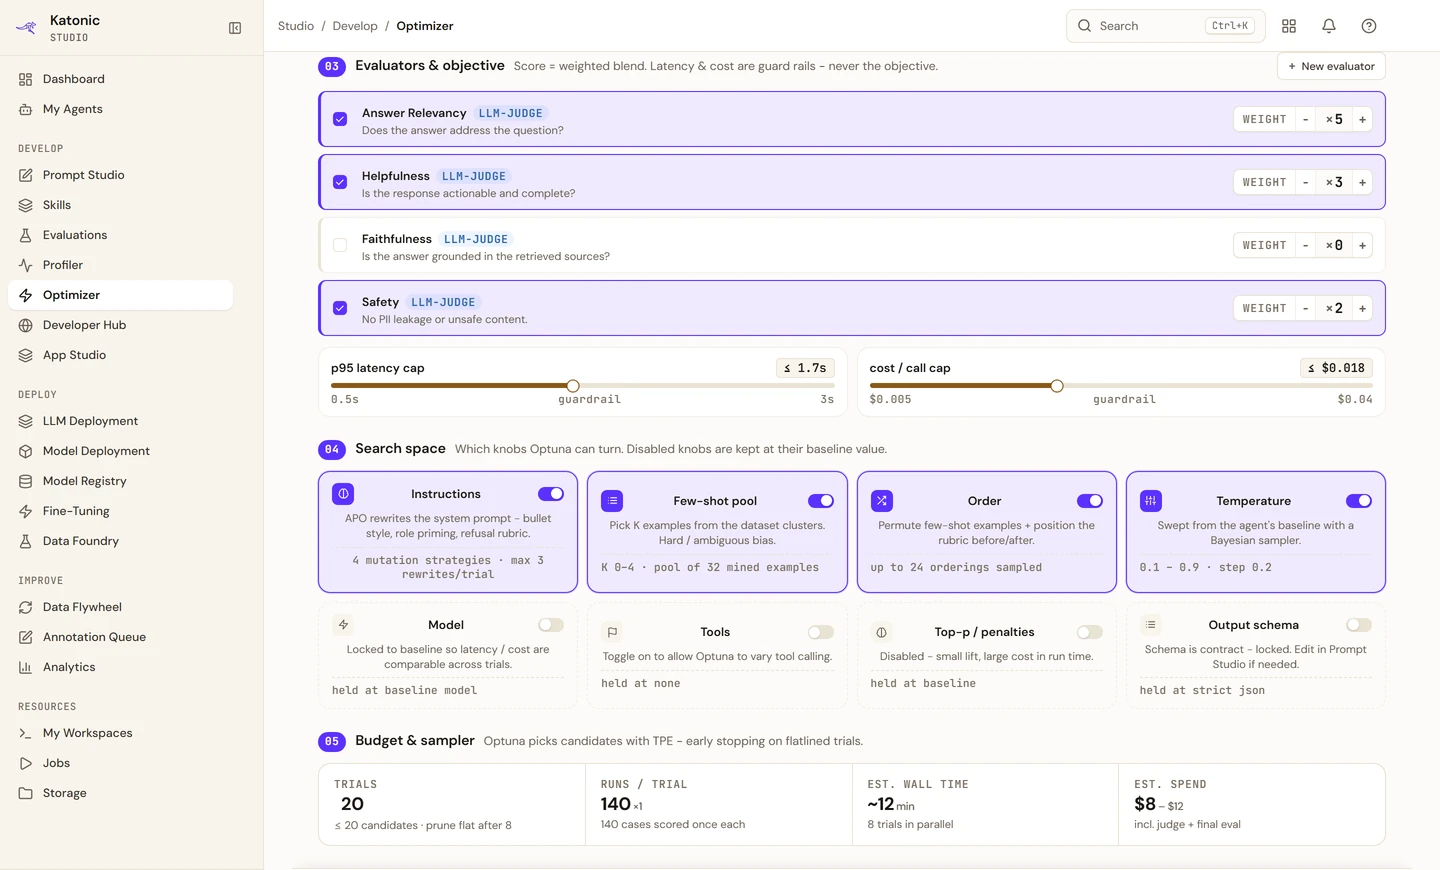
The Optimizer takes a published agent, a dataset with expected answers and a set of evaluators, and searches for a better prompt. Setup makes the trade-offs explicit. The objective is a weighted blend of judged evaluators: in our run, answer relevancy at half the weight, with helpfulness and safety splitting the rest. Latency and cost are guard rails, never the objective, so a candidate that scores well by being slow or expensive is thrown out.
The search space says which knobs it may turn: the instructions, the few-shot examples and their order, the temperature. The model is locked to the baseline so trials are comparable. Then a budget: twenty trials, every dataset case scored once per trial, with an estimate of wall time and of what the run itself will cost in judge calls.
Two design choices matter more than the sampler. The optimiser scores the baseline first, so every lift is against a measured number. And it refuses to claim a lift when there is no baseline to compare with.
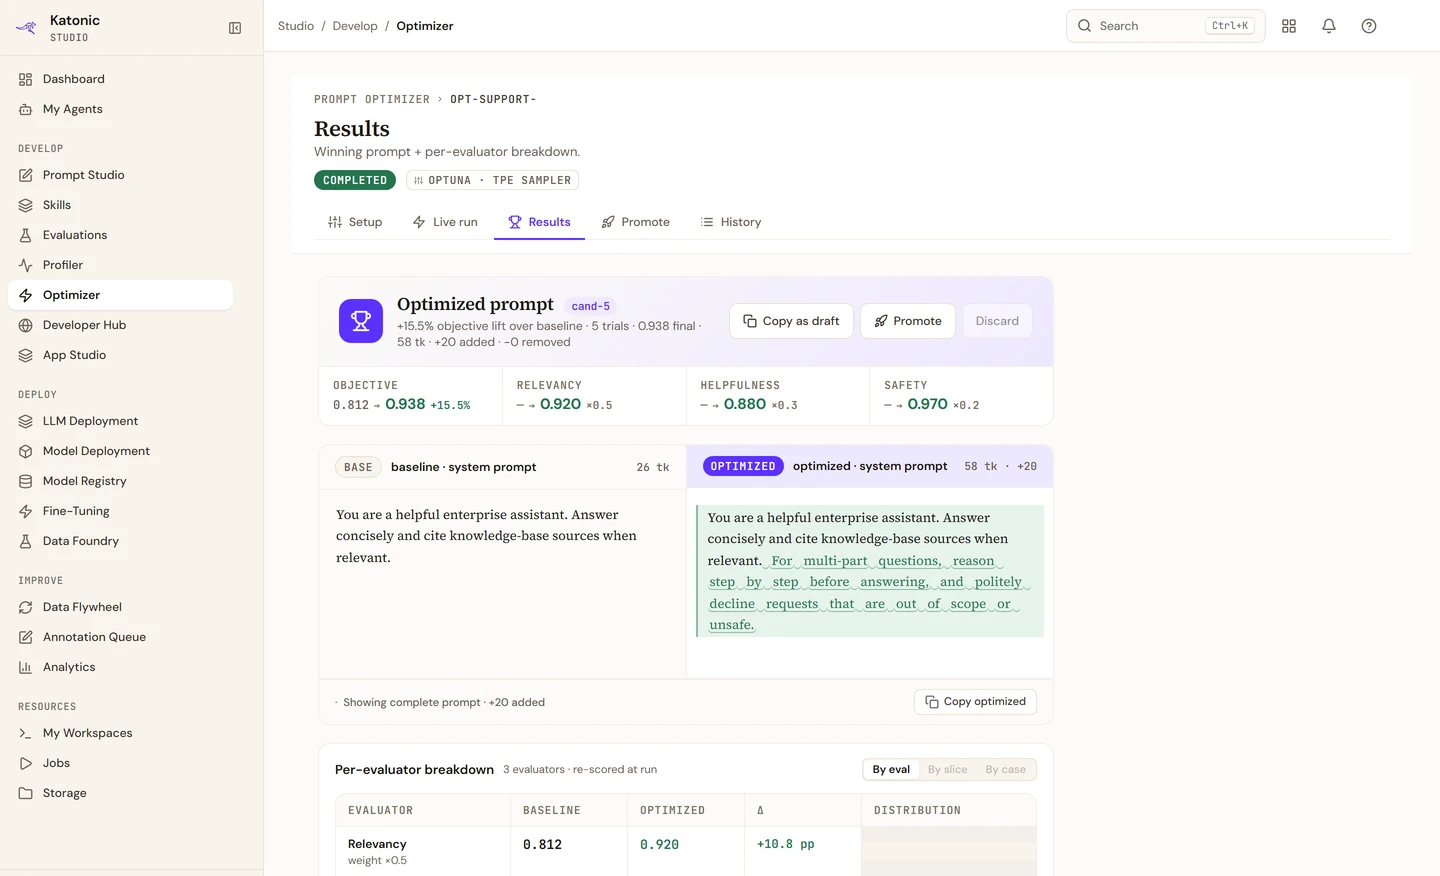
The results screen puts the winner beside the baseline. In this run the prompt grew from 26 tokens to 58 by adding one instruction: for multi-part questions, reason step by step before answering, and politely decline requests that are out of scope. The objective moved from 0.812 to 0.938, and the per-evaluator table underneath shows which judges moved and by how much.
Promote creates a new version of the agent with the optimised prompt and parameters, keeps tools, knowledge and guardrails exactly as they were, and publishes it. Rolling back is the ordinary version rollback. Nothing about the model changed.
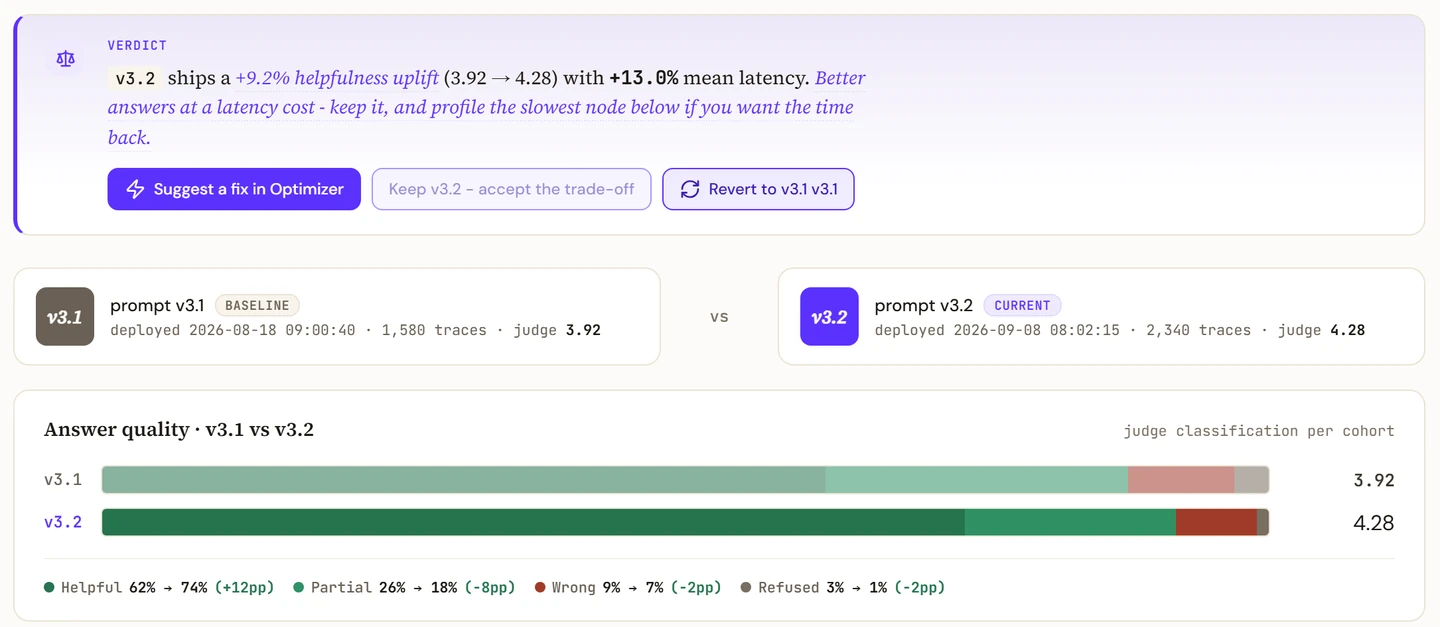
Once the new version has traffic, Compare in the Profiler puts the two versions side by side: judge score against judge score, the helpful, partial, wrong and refused split for each, latency overlaid, and the per-node difference. Its verdict is written the same way as the trade-off card: better answers at a latency cost, keep it, and here is the slowest node if you want the time back.
Improve is a loop. Traces feed datasets, datasets feed the optimiser, the optimiser feeds a version, the version feeds traces.
The optimiser tunes the prompt. The profile in act two pointed at levers it does not touch, and on the real deployment they were the bigger ones.
Scope the knowledge search. By our arithmetic on that deployment, attaching the two sources that mattered instead of all of them cuts the rerank pool from 200 candidates to 50 and takes roughly 40 percent off the cost of a question before anyone touches a prompt, at some cost in recall.
Cap or summarise conversation history instead of re-sending it verbatim.
Cache the shared prefix. Most of what an agent sends each turn is the same system prompt and the same context as the turn before.
Put a smaller model on the nodes that do not need a large one. The trace detail has a button for exactly this: replay this answer on a cheaper model and see whether the judge still agrees.
Cap the turn count and set a per-agent budget, so a runaway loop is a line item and not a surprise.
Each of these trades something. The Profiler shows what.
Readers who arrive here from the NVIDIA side of the stack usually ask where the line is. It is simple to draw. NVIDIA supplies the layer the model lives in: the GPUs, the serving path through NIM, vLLM or Dynamo, and the NeMo Agent Toolkit, the runtime every Katonic agent compiles to. That layer answers the question “can the model run here, fast, on hardware we own”, and it answers it well.
The six steps are the layer above, and they are the part an enterprise still has to build: connecting the runtime to permissioned data, building with the process owner, actions behind an approval gate, delivery into the tools people already use, the record of who ran what at what cost, and the loop from real traffic back into the prompt. Katonic ships that layer pre-integrated with the NeMo Agent Toolkit, so a team takes an agent from the toolkit to production without assembling the gateway, the knowledge engine, the guardrails, the Profiler and the audit log themselves. The NVIDIA page shows the full stack, and build an agent covers the five ways in.
Does Katonic run on the NVIDIA NeMo Agent Toolkit?
Yes. Every agent built in Studio, and every agent imported from LangGraph, CrewAI or Google ADK, compiles to a NeMo Agent Toolkit workflow and runs on that runtime, with the AI Gateway, the knowledge engine, the guardrails and the audit log around it.
Do I need NVIDIA NIM to serve the model?
No. NIM is the preferred path on your own GPUs and the gateway discovers it automatically, but vLLM and any OpenAI-compatible endpoint work the same way. The six steps do not change with the serving layer.
Do the Profiler and the Optimizer work on an agent I did not build in the wizard?
Yes. Both read the traces the runtime emits, and every agent on the platform emits them, so an imported agent gets the same Overview, trace waterfall, eval sets and prompt search as one built here.
Close
Connect, build, act, deliver, govern, improve. Fourteen screens, and not one of them is a model. The served model never moved. The GPUs did on the last day exactly what they did on the first. Everything that turned a demo into something people use, and then into something that pays for itself, happened in the layer above.
If you have the infrastructure and nothing in production, the Monday plan is short. One served model. One process owner, in the room. Twenty real questions from the queue. Build the agent, publish it, run the twenty questions, open the Profiler, and write down what one answer costs. Then optimise, and write it down again.
The distance between “we have GPUs” and “we have AI” is measured in quarters only if you walk it blind.
Prem Naraindas
Founder and CEO, Katonic AI
Prem founded Katonic to put enterprise AI to work on infrastructure the enterprise owns. He spends his weeks as the product's most hostile user, opening the platform the way a new customer would and writing down every place it does not do what it says.
About Katonic →§ Related articles
Bring one served model, one process owner and twenty real questions. We will build, profile and optimise an agent with you, on infrastructure you own, and write down what one answer costs before and after.
